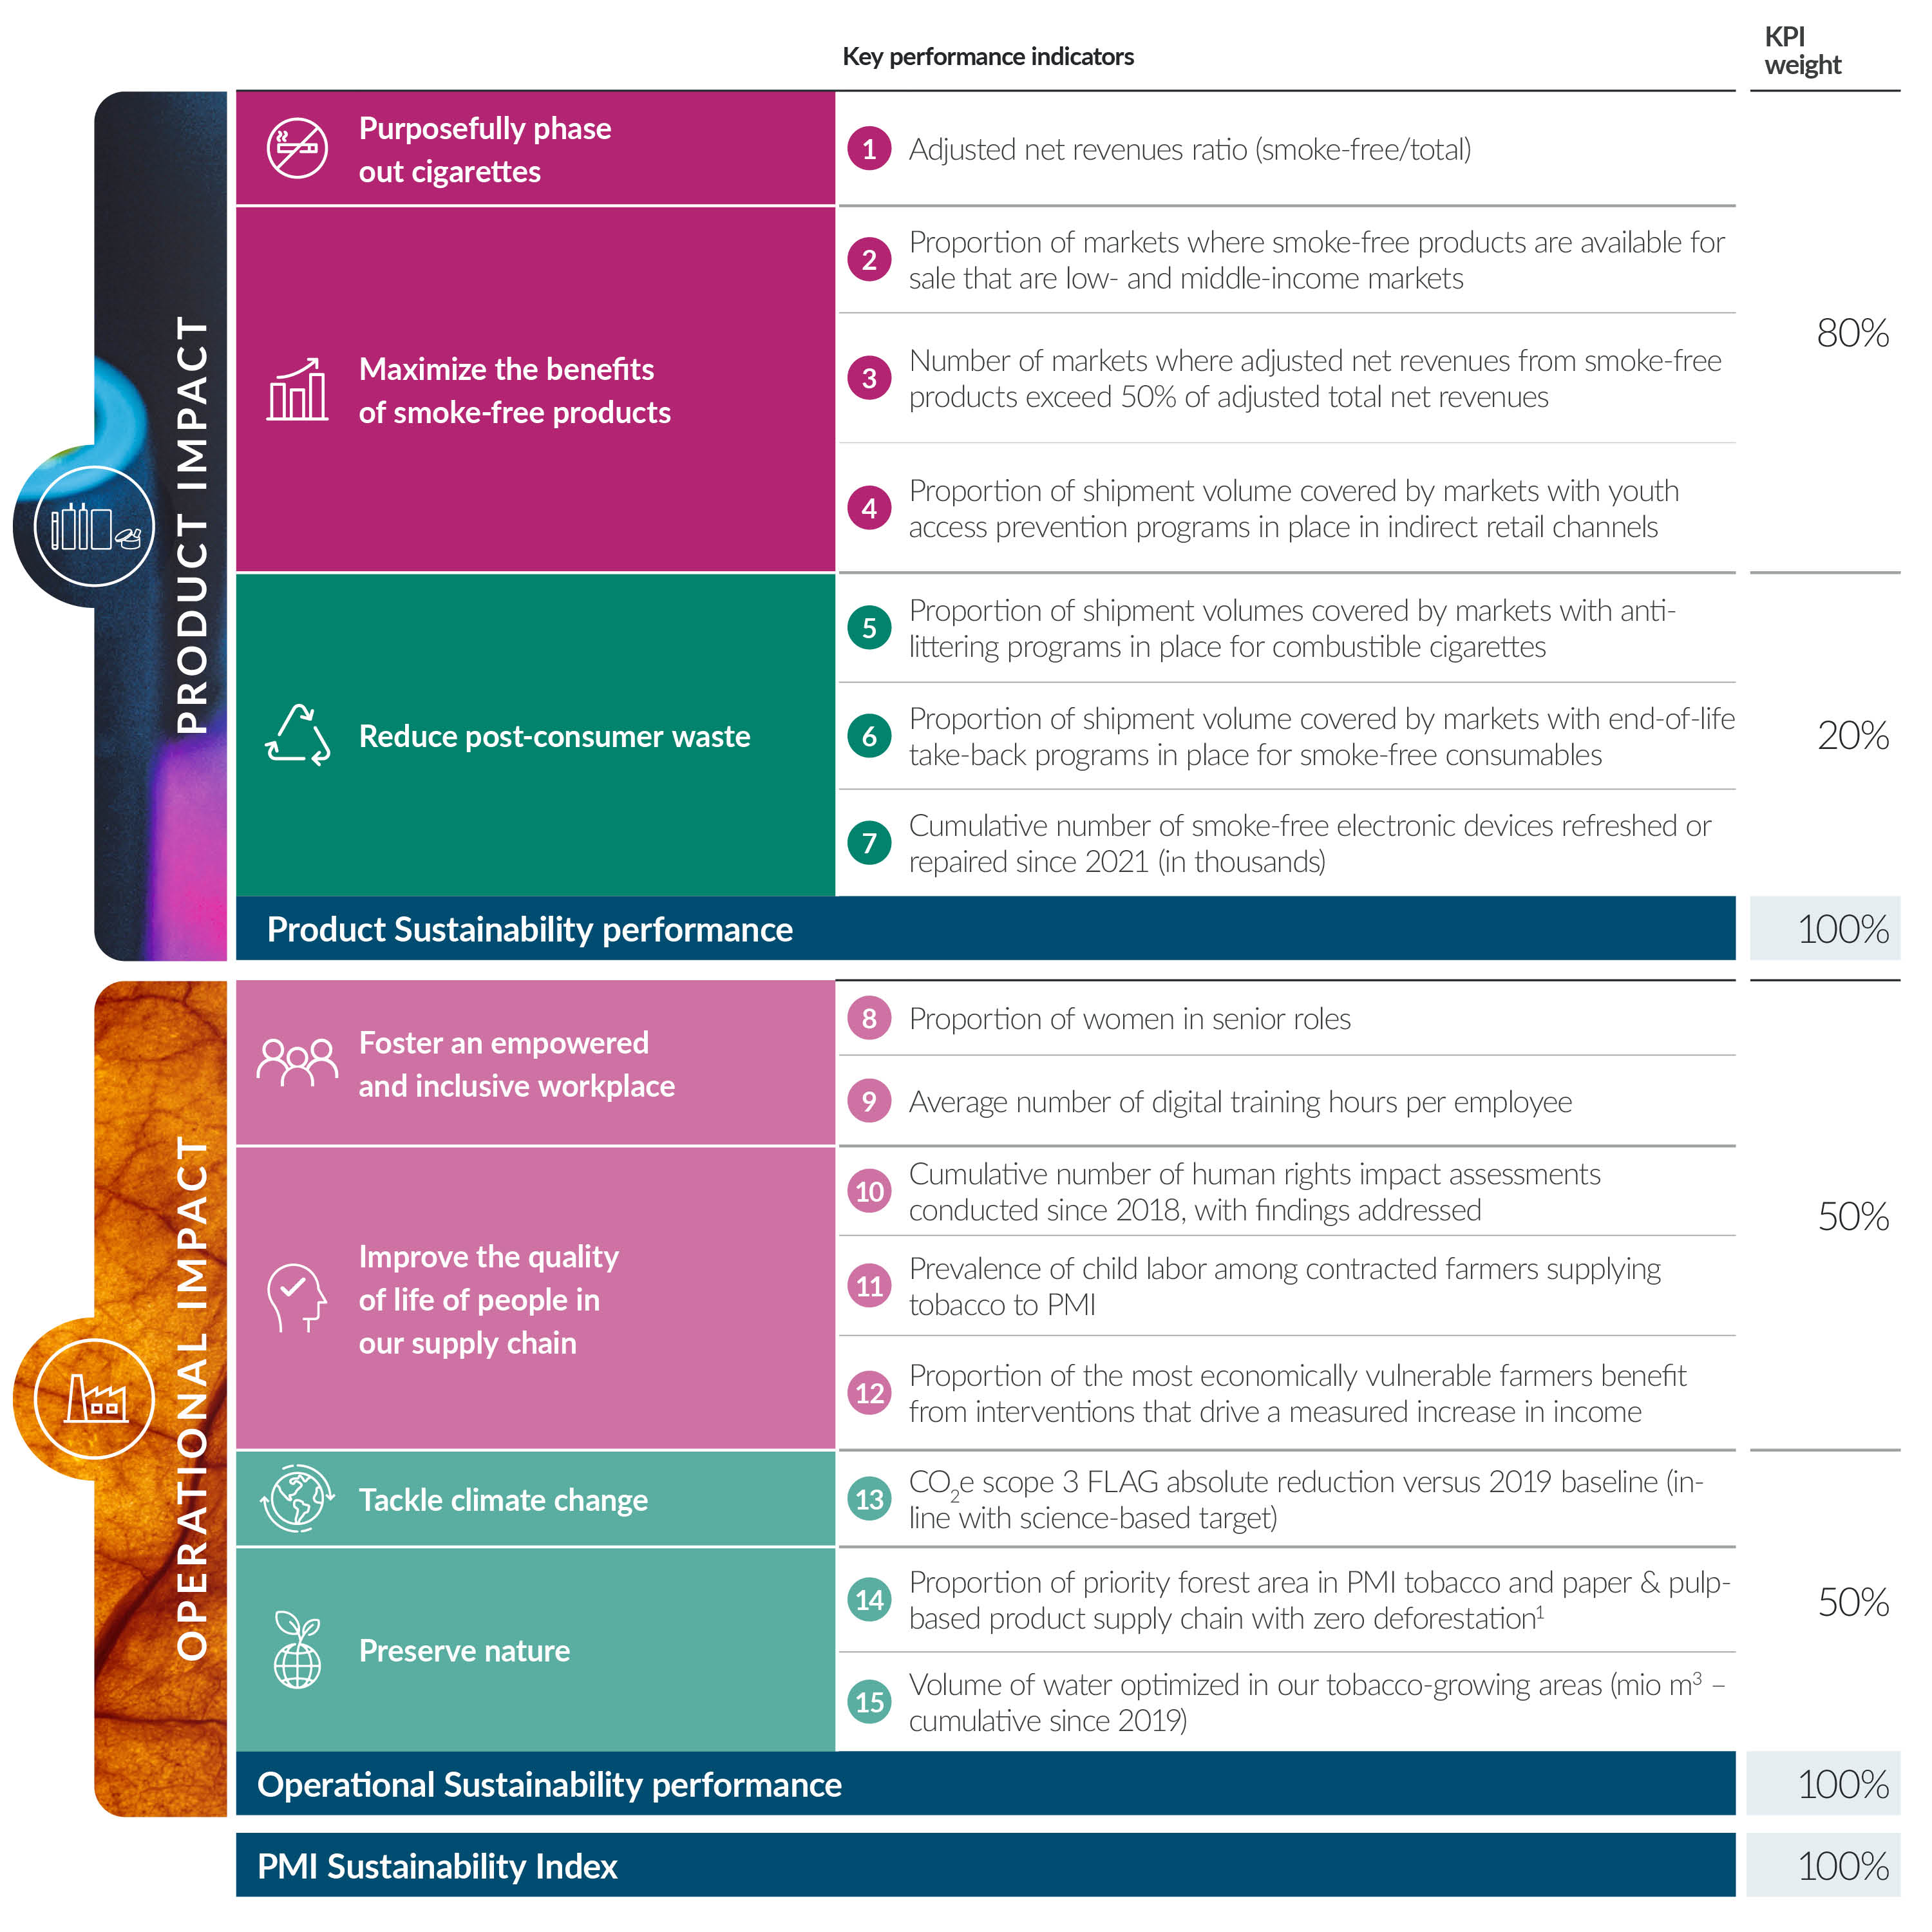
Our Sustainability Index and ESG KPI Protocol should be regarded as a framework and reference guide to help provide consistency and completeness in our reporting and should be read in conjunction with our annual Integrated Report.

Sustainability Index

During 2021, we developed a bespoke Sustainability Index (the Index) to measure and communicate progress toward achieving our 2025 Roadmap  in a rigorous and quantitative manner, using a set of clearly defined and verifiable metrics. 

Further, the introduction of the Index creates an explicit link between ESG performance and our company's long-term executive compensation scheme.


Notes:

The 2022 metrics marked with an asterisk (*) are subject to PwC’s Limited Assurance Report available on pages 210-212 of
PMI’s Integrated Report 2022.

Our inventory of GHG emissions (scope 1, 2, and 3) in 2022 is subject to external verification by SGS (see the External Verification Statement for scope 1+2 here, for scope 3 here, and a list of the individual metrics verified here).

For further details on the definitions, scope, calculation methodology, and data management for the metrics included in PMI’s Sustainability Index, please refer to
PMI's ESG KPI Protocol 2022 .

  1. These indicators are calculated based on millions of units. For definition of smoke-free products and combustible tobacco products, see glossary on pages 205-209 of PMI’s Integrated Report 2022. Smoke-free products shipment volume includes volume of smoke-free products that can be converted into cigarette equivalent units, such as heat-not-burn, e-vapor, and oral nicotine. Total shipment volume includes the listed smoke-free products as well as combustible tobacco products: cigarettes and other tobacco products expressed in cigarette equivalent units. Data does not include Swedish Match and wellness and healthcare products.
  2. For definition of net revenues related to smoke-free products, see glossary on pages 205-209 of PMI’s Integrated Report 2022. 2022 figure includes Swedish Match net revenues from November 11, 2022 (acquisition date) to December 31, 2022.
  3. Including Swedish Match.
  4. Excluding PMI Duty Free. World Bank report issued in July 2022 is used on a comparative basis for income level classification. For definition of low- and middle-income markets, see glossary on pages 205-209 of PMI’s Integrated Report 2022.
  5. Figures pertain to total IQOS users. See glossary on pages 205-209 of PMI’s Integrated Report 2022.
  6. Total shipment volume includes cigarettes, OTPs, and smoke-free product consumables.
  7. For definition of net revenues related to wellness and healthcare, see Glossary.
  8. In 2022, we redefined the minimum criteria which must be met by each market to be considered as having a take-back program in place. Shipment volume includes heated tobacco units, e-vapor cartridges, and e-vapor disposables.
  9. To meet our 2025 aspiration, we may consider either a type 1 or type 2 and/or type 3 product environmental statements as defined by ISO 14020:2022, as constituting an “eco-certification”.
  10. For definitions of managers, directors, and senior leaders see glossary on pages 205-209 of PMI’s Integrated Report 2022, Our diversity and inclusion data cover around 94% of PMI’s total workforce, as they exclude fixed term employees and those on salary continuation.
  11. Our assessments prioritize countries which are assessed as highest risks from a human rights standpoint. They are determined based on key parameters such as PMI’s footprint and the country’s human rights risk profile, as determined by internationally recognized organizations.
  12. Emissions from PMI-operated IQOS stores are partially excluded from scope 1+2 emissions, as de minimis. In 2022, a portion of PMI‘s retail stores (representing approx. 10% of total retail surface area) have been included in the scope 1+2 emissions.
  13. For definitions, please see PMI's Zero Deforestation Manifesto.

Index weighting

The Index is composed of 19 KPIs which are connected to our eight sustainability strategies.

Read more

Index weighting

The Index is composed of 19 KPIs which are connected to our eight sustainability strategies.

These strategies are aggregated into two performance measures:

1. Product Sustainability

Consolidates the four strategies linked to our product-related impacts (purposefully phase out cigarettes, maximize the benefits of smoke-free products, seek net positive impact in wellness and healthcare, and reduce post-consumer waste).

2. Operational Sustainability

Consolidates the four strategies linked to our business operations-related impacts (foster an empowered and inclusive workplace, improve the quality of life of people in our supply chain, tackle climate change and preserve nature).

Consistent with our sustainability materiality analysis results, addressing the impacts generated by our products stands at the core of our strategy. The Sustainability Index reflects this by attributing two thirds of the total Index weight to Product Sustainability and one-third to Operational Sustainability.

Given the bespoke nature of the Index, external guidelines on how to weight each of the strategies within our two performance measures are not available. Therefore, to ensure credibility and consistency, we relied on a quantitative and qualitative interpretation of our 2021 sustainability materiality assessment results.

Accordingly, within the Product Sustainability performance measure, we overweight the three strategies that aim to address the social impact of the product (i.e., purposefully phase out cigarettes, maximize the benefits of smoke-free products, and seek net positive impact in wellness and healthcare). Collectively, these strategies represent 85 percent of the Product Sustainability performance measure. The remaining 15 percent is attributed to the strategy which addresses the environmental impact of our products (i.e., reduce post-consumer waste).

In contrast to the impacts generated by our products, the social and environmental impacts of our operations are more balanced. Therefore, within the Operational Sustainability performance measure, the two social-related strategies (i.e., foster an empowered and inclusive workplace (20 percent) and improve the quality of life of people in our supply chain (30 percent)) together represent half of the weight, and the two environmental-related strategies (i.e., tackle climate change (40 percent) and preserve nature (10 percent)) account for the other half.

The respective weight of each strategy is driven by the results of the materiality assessment; strategies to address topics that were identified as most material are attributed a higher weight than those topics identified as emerging. For example, aligned to its prominence in our sustainability materiality assessment, the strategy “tackle climate change” is overweighted compared to the “preserve nature strategy” which addresses the emerging topics of biodiversity and water.

Each strategy is connected to one or more individual KPI(s). For simplicity, the KPIs are equally weighted within their respective strategy. To ensure each KPI contributes meaningfully to the Index, we have set a minimum threshold weight to any individual KPI.

Annual targets and performance ranges

In our Integrated Report, we disclose our 2025 aspirations.

Read more

Annual targets and performance ranges

In our Integrated Report, we disclose our 2025 aspirations.

Internally, our 2025 Roadmap is supported by the annual targets and performance ranges for each KPI. Specifically, starting in 2022, for each KPI we have defined annual targets and four performance ranges quantifying the performance versus the annual target as either “missed”, “partially met”, “met”, or “exceeded” for the respective year.

Calculation of the Index score

Performance ranges

Given the significant variation in the nature of the KPIs included in the Index and in the maturity of the underlying strategy and programs, a strategic approach was taken to determine a wide or narrow performance range per KPI based on PMI’s (i) ability to control, (ii) maturity on the topic, and (iii) forecasting accuracy.

At the close of each reporting year, for each KPI we will assess the Company’s actual performance against the respective performance ranges. This assessment forms the basis of our calculation of the Index score, described in further detail in the following section.

Governance

On an annual basis, we calculate the total Index score. The annual targets and performance ranges have been provided by the relevant business functions and validated by the Company’s Chief Financial Officer, VP & Controller, Chief Sustainability Officer, and VP Strategic Planning & Business Intelligence.

In addition to bringing further transparency to our stakeholders about the progress we are making toward achieving our goals, the Index helps us cascade sustainability priorities throughout all levels of the Company, serving as inputs into both business function and individual objectives. This enables us to integrate ESG considerations into strategy, creating deep organizational alignment.

Link to long-term executive compensation

The Index has been incorporated into our executive compensation.

Read more

Link to long-term executive compensation

The Index has been incorporated into our executive compensation.

Reflecting the weight of the Index, the Product Sustainability constitutes 20 percent, and the Operational Sustainability constitutes 10 percent, which together amount to 30 percent of the total PSU award. In line with the governance for our executive compensation, the targets and performance ranges for each of the 19 KPIs, notably for the period ending December 2024, were therefore approved by our Board of Directors in Q1 2022.

For the remaining 70 percent of the total PSU award, the Board retained the previously used metrics of Total Shareholder Return (TSR), weighted 40 percent, and currency neutral adjusted compound annual diluted earnings per share (EPS) growth, weighted 30 percent. For more information on our proxy statement.


As with our 2025 Roadmap, the Index splits  the 19 KPIs into two drivers: “Product Sustainability” (11 KPIs) and “Operational Sustainability” (eight KPIs). 

To form the Index, we sought KPIs that were: 

  • Well defined, allowing for accurate, reliable, and consistent measurement of progress over time
  • Meaningful, enabling stakeholders to assess our company’s progress toward its priority sustainability topics 

The weighting applied to each KPI is informed by the results of our sustainability materiality assessment. Specifically, we attributed the highest weight to the social impacts of our products, where we believe our company can have the greatest impact.


ESG KPI Protocol

The ESG KPI Protocol (the Protocol) establishes a framework, which is specific to our company and clearly defines KPIs that can provide our organization with a method for making the connection between our company’s purpose, strategic direction, financial performance, and environmental and social considerations. It includes the definitions, methodology, and scope of each of the Index’s 19 KPIs to provide measurable, verifiable, consistent, and accurate reporting on progress.

It is key to the integrity of our reporting that the information and data that we publicly disclose accurately reflect our company’s performance, following clear calculation methods. 

Through the publication of this Protocol, we aim to provide further transparency on the key metrics we use to measure how our company is delivering on its purpose and creating value for our shareholders and other stakeholders. 

Jennifer Motles, Chief Sustainability Officer, PMI

PMI’s ESG KPI Protocol and Sustainability Index act as a tool to engage employees at all levels of the organization, support program owners by ensuring key sustainability initiatives are prioritized, and act as a vessel through which we continue to build capabilities within our financial, IT, and risk management functions regarding management of ESG performance. Externally, it allows us to communicate with rigor, accuracy, and credibility our annual progress using a robust data-driven approach to managing our most material ESG-related risks.

Jennifer Motles, Chief Sustainability Officer

“As sustainability matures and gains importance inside and outside our company, the question of how to measure ESG performance is something many continue to grapple with,” said Jennifer Motles, PMI’s Chief Sustainability Officer.

“There is a need for greater transparency, more robust methodologies, and better clarity on definitions and assumptions. Accordingly, we developed a clear process for establishing concrete definitions, documentation, and controls for sustainability with the aim of standardizing how we measure ESG performance.”

Externally, the Protocol helps ensure that the ESG data we disclose is reliable, comparable, and meaningful, allowing our stakeholders to assess and track progress in a consistent manner over time. 

Internally, the Protocol offers clear guidelines on ESG data management to support integrated decision-making within our company, accounting for both financial and non-financial information.

We will review the Protocol periodically to reflect relevant developments, such as changes in business priorities, revised methods of measuring or capturing data, stakeholder feedback, and developments related to mandatory and voluntary reporting frameworks and standards.


05.04.2023

Read PMI's ESG KPI Protocol 2022

download

05.04.2023

Read PMI's ESG KPI Protocol 2021

download