| INTEGRATED REPORT 2019 |
Progress in 2019
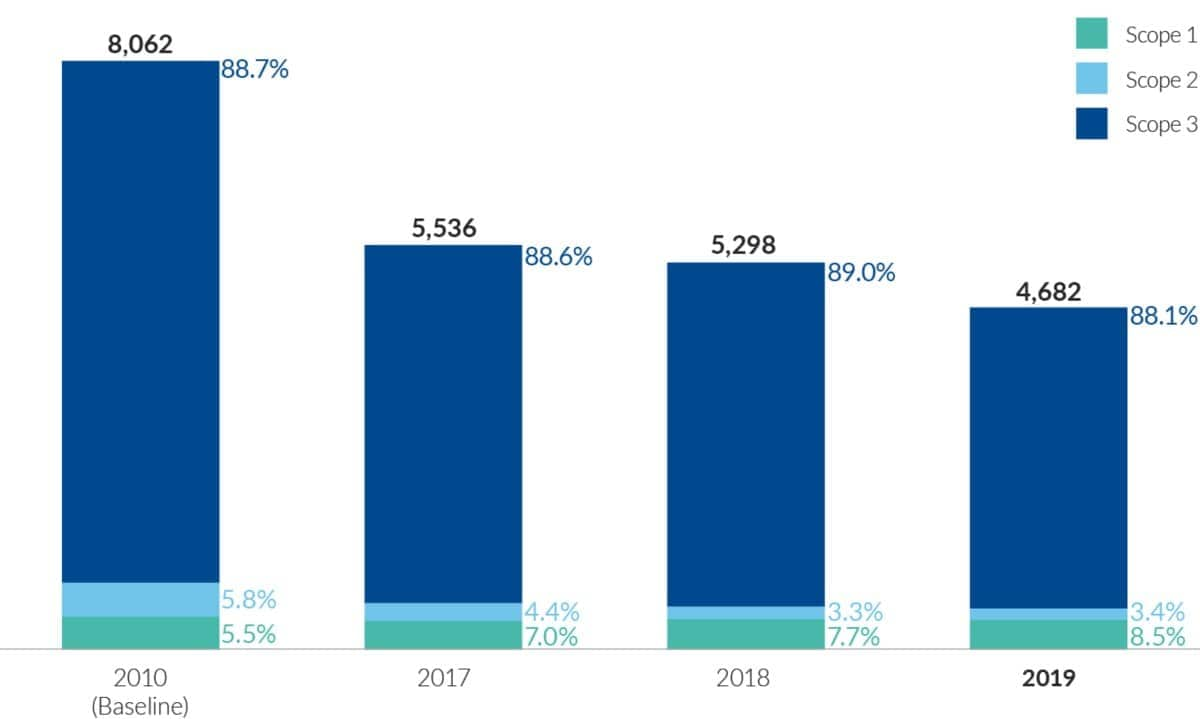
Our 2019 carbon footprint
Reducing carbon emissions is central to PMI’s environmental management, alongside our adaptation to the potential business impacts of climate change. All emissions generated across our value chain contribute to our carbon footprint. Carbon emissions principally occur upstream, including those generated by curing fuels and fertilizers in our tobacco supply chain, acquiring direct materials such as paper and cellulose acetate tow, and procuring indirect materials and services such as marketing, sales, and other professional services. Although manufacturing represents a smaller part of our footprint, we recognize that more energy is required to produce IQOS heated tobacco units compared to cigarettes, with a consequent increase in greenhouse gas emissions. We are seeking to reduce this impact.
Carbon emissions along our value chain in 2019

Presentation of information aligns with guidance of the Greenhouse Gas Protocol.
Based on our footprint model, our carbon reduction strategy focuses on four climate impacts across our value chain:
Direct operations (factories, offices’ and fleet): We aim to become carbon-neutral by 2030.
Tobacco supply chain: Working with our suppliers and farmers, we seek to reduce carbon emissions created by tobacco cultivation, with a special focus on tobacco curing. We aim to improve curing efficiency, promote the adoption of biomass fuels, and ensure sustainable and traceable firewood.
Direct materials supply chain: We are further accelerating the deployment of our supplier engagement strategy across all our procurement categories to achieve greater coverage, hence carbon footprint reductions. We focus on:
- ensuring CO2 supplier measurement capabilities;
- establishing deep-dive carbon value chain analysis;
- identifying and delivering supplier improvement plans; and
- consolidating, validating and reporting on data and results.
Product development: We have introduced a set of sustainable design principles aimed at reducing the environmental footprint of our new products.
We are on track to achieve our current targets, with an absolute reduction versus 2018 in scope 1 emissions of 3 percent, in scope 2 of 10 percent, and in scope 3 of 12 percent, amounting to an overall reduction of 615,595 tons of CO2e in 2019.
We are on track to achieve our current targets, with an overall reduction of 615,595 tons of CO2e in 2019
Global greenhouse gas emissions scope 1, 2, and 3 ('000 tons CO2e)
Toward carbon-neutral manufacturing
Our strategy follows a three-step approach:
drive energy efficiency to reduce consumption;
switch to renewable energy, including green electricity; and
as a last resort, offset unavoidable carbon emissions, ideally by in-setting projects developed in our supply chain and generating certified carbon credits, and alternatively by purchasing carbon credits.
In 2019, our factory in Klaipèda, Lithuania, became our first carbon-neutral factory, receiving its certification from Swiss nonprofit myclimate (read more on the next page). We are aiming for an additional two production sites to be certified by 2021.
Decarbonizing our direct operations: our strategy
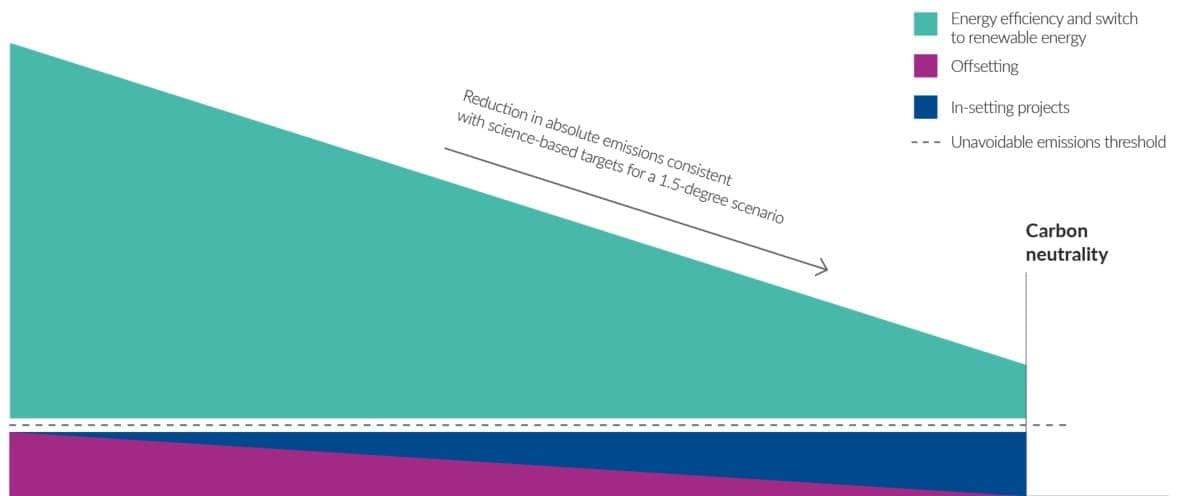
We are aiming for an additional two production sites to be certified carbon-neutral by 2021.
Klaipėda, Lithuania: Our first carbon-neutral factory
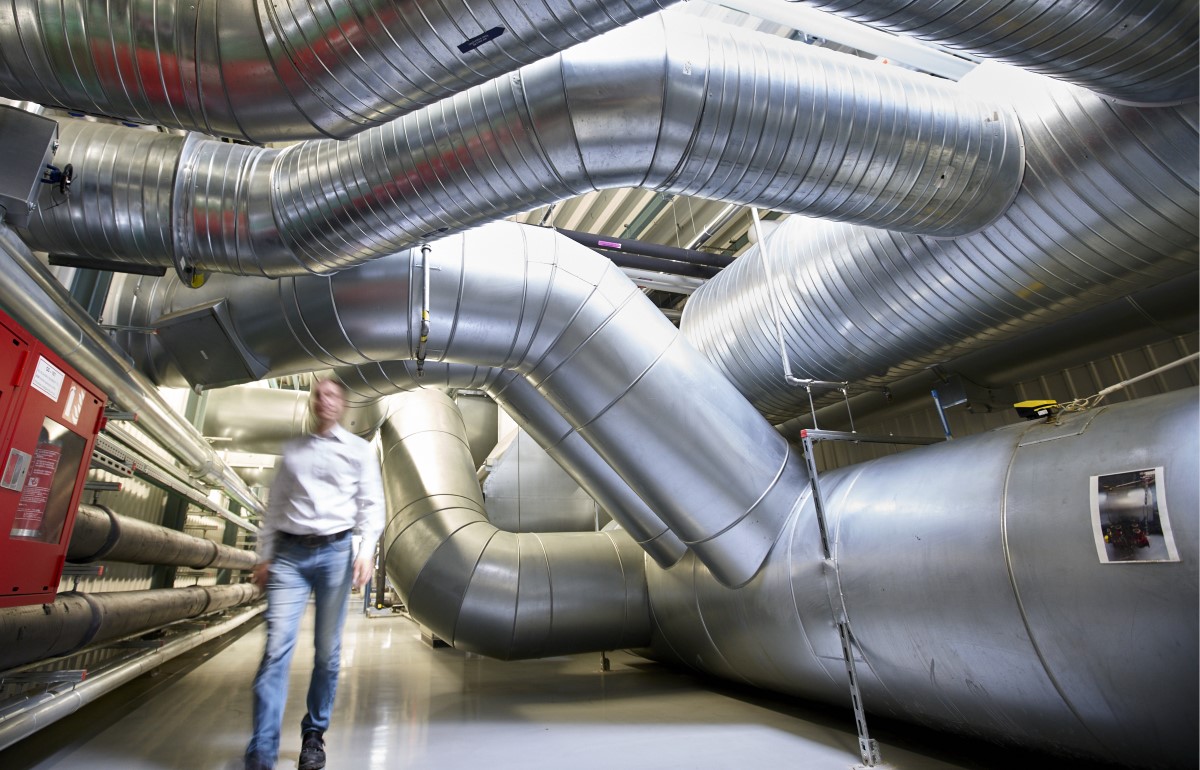
In 2019, we reached the first milestone toward carbon neutrality in our factories – through energy-saving measures, renewable energies, and carbon offsets at our site in Klaipèda, Lithuania. Our factory there has been in operation since 1997 and employs over 500 people. We have been running energy-efficiency projects at the site for many years, upgrading utility equipment, such as chillers and compressors, and facilitating heat recovery to optimize fuel use, including installing a biomass boiler.
Combined, these initiatives reduced our carbon emissions by 47 percent versus our 2010 baseline. As part of our renewable energy strategy, we purchase certified renewable electricity and offset natural gas carbon emissions with biogas certificates. These efforts led to a 52 percent reduction in our carbon emissions versus 2010. To offset the remaining 1 percent carbon emissions at this factory, we invested in Gold Standard certificates from a climate protection initiative seeking to switch households in India from kerosene and firewood to biogas.
Klaipėda: carbon-neutrality journey

Driving energy efficiency
Our activities in this area center on our Drive 4 Zero program, which aims to eliminate economic losses caused by inefficient energy use. Under the program, we look for industrial and manufacturing solutions such as heat recovery and manufacturing-process optimization. We also promote behavioral change through our Zero Loss Mindset program.
In our factory in Russia, for example, it was necessary to drain around 1 percent of the steam our boiler produced to maintain the desired water-quality parameters. This meant heat loss. We found a way to recover the wasted heat by installing a heat exchanger, which used the heat to generate steam. In that same factory, the water used for domestic purposes and radiators was heated by inefficient electric heaters, leading to avoidable losses. We installed a thermal pump that was five times more efficient, leading to a reduction of 210 tons of CO2 equivalent (CO2e) per year.
Switching to renewable energy
We implement renewable technologies across our manufacturing sites. This includes producing greener energy via photovoltaic panels and tri-generation processes (combining cooling, heat, and power). We also focus on thermal energy by installing biomass boilers and heat pumps and investigating pyrolysis techniques.
In 2019, we operated five biomass boilers in our manufacturing facilities and installed a total of 6,660 square meters of photovoltaic panels, contributing to a total of over 72,300 square meters of photovoltaic panels in our manufacturing facilities. We select technologies based on clearly defined criteria: They must lead to an annual emissions reduction, have a payback period of no more than five years, and be among the more cost-effective projects in comparison to other carbon emissions reduction projects proposed within PMI.
To complement our approach, we also purchase certified green electricity. We aim to source 100 percent green electricity in our manufacturing sites by 2025. Finally, we have worked to eradicate coal from our factories. We achieved this at the end of 2019 by replacing our last coal boiler, located in our South African factory.

In 2019, we installed a total of 6,660 square meters of photovoltaic panels in our manufacturing facilities
Internal carbon pricing at PMI
Over the last years, PMI has applied an internal carbon price of USD 17 per ton of CO2e in order to allocate capital for the best return in terms of carbon reduction and cost-effectiveness. As we are stepping up our ambition to reduce carbon emissions, we started an internal project to define a carbon price that will align with the 1.5-degree target and help to solidify the company’s climate leadership.
Based on a comprehensive review of policies and methodologies applied by organizations across a variety of industries, we recognize the importance of defining a carbon price that will remain consistent over time and ensures that climate transition risks are embedded in capital expenditure decisions.
We are considering setting a shadow price to drive investment decisions as well as a carbon levy:
Shadow pricing will enable us to include carbon prices when evaluating alternative investment options; for instance, for capital expenditure decisions.
A carbon levy would enable us to internalize external costs by charging our business functions or affiliates for their respective emissions. With the aim of supporting behavioral change, the levy would be collected in a climate fund, which could finance high-quality carbon in-setting or off-setting projects.
We plan to finalize our approach during 2020 and report next year on its implementation.
In-setting and off-setting unavoidable carbon emissions
We compensate our absolute carbon emissions only as a last resort – once we have maximized our emissions reduction via energy efficiencies and renewable energy. We do so ideally through in-setting projects or alternatively by purchasing certified carbon credits.
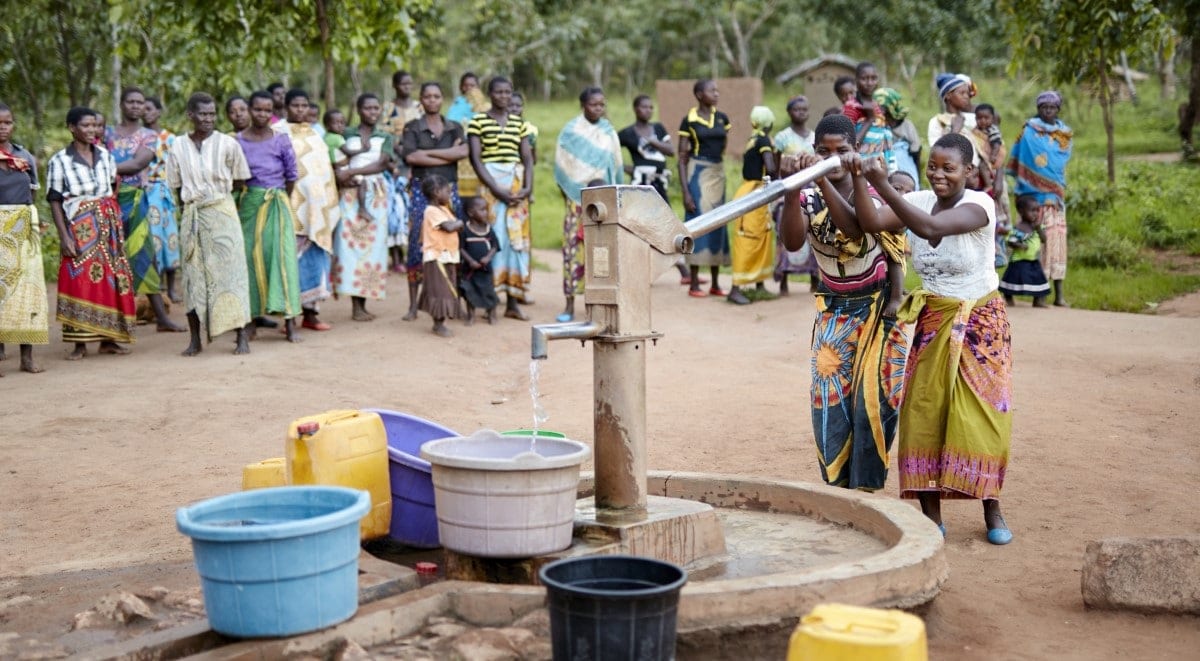
As an example of an in-setting project, in collaboration with CarbonSink we evaluated the feasibility of a project that would provide access to clean and safe drinking water to farmers within the tobacco-growing areas of Mozambique – in line with our water, sanitation, and hygiene (WASH) program, also benefiting the schools we support through school feeding initiatives. We determined that the best approach would be to pilot 10 water access sites to determine how well the selected technology works within the local context and its potential to scale up. Ideally, the project will qualify for certification by the Gold Standard Foundation, thereby generating internationally recognized verified emission reductions and contributing to PMI’s carbon-neutrality targets. According to our feasibility assessment, the installation of 10 boreholes could benefit around 35,000 people and avoid 865,000 tons of CO2 emissions over 10 years, while providing approximately 245 cubic meters of water per day.
Offices and fleet
In addition to our carbon-reduction efforts at our manufacturing facilities, which represent most of our scope 1 and 2 emissions, we are also exploring ways to reduce emissions from our offices and fleet. In our fleet, we plan to improve efficiency through telematics, increasing the proportion of electric and hybrid vehicles, and providing eco-driving training to reduce our emissions further. In our offices, we are focused on strengthening our reporting to identify appropriate interventions. Some of our offices are already reducing their footprints; this is the case, for example, with our Operations Center in Switzerland, which became carbon-neutral in 2019.
In our fleet, we plan to improve efficiency through telematics, increasing the proportion of electric and hybrid vehicles, and providing eco-driving training to reduce our emissions further.
Reducing carbon in our tobacco supply chain
We are currently running strategic initiatives to reduce carbon emissions in our tobacco supply chain, which are focused on three areas: reducing fuel consumption by improving curing-barn efficiency, promoting the switch from fossil fuels to biomass fuels, and ensuring sustainable and traceable firewood. In our tobacco supply chain, we achieved an absolute reduction in 2019 of 244,423 tons of CO2e versus the previous year, with over two-thirds of that reduction attributable to efficiency gains in curing barns and reductions in use of curing fuels.
Reducing fuel consumption by improving curing-barn efficiency
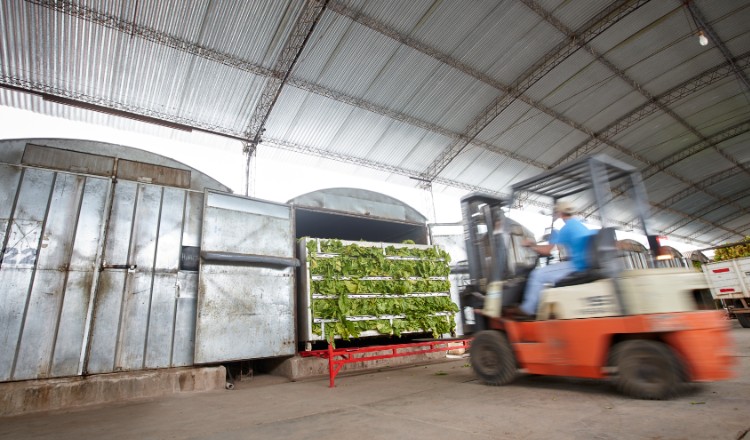
We mainly source three types of tobacco: Virginia, Burley, and Oriental. Virginia tobacco (approximately 46 percent of purchased volumes) is cultivated around the world and, once harvested, must be cured to dry out the leaves using an external heat source. Curing barns may be heated with coal, diesel, natural gas, firewood, or biofuels such as agricultural by-products. The GHG emissions of flue-cured tobacco curing represent 10 percent of our total carbon footprint.
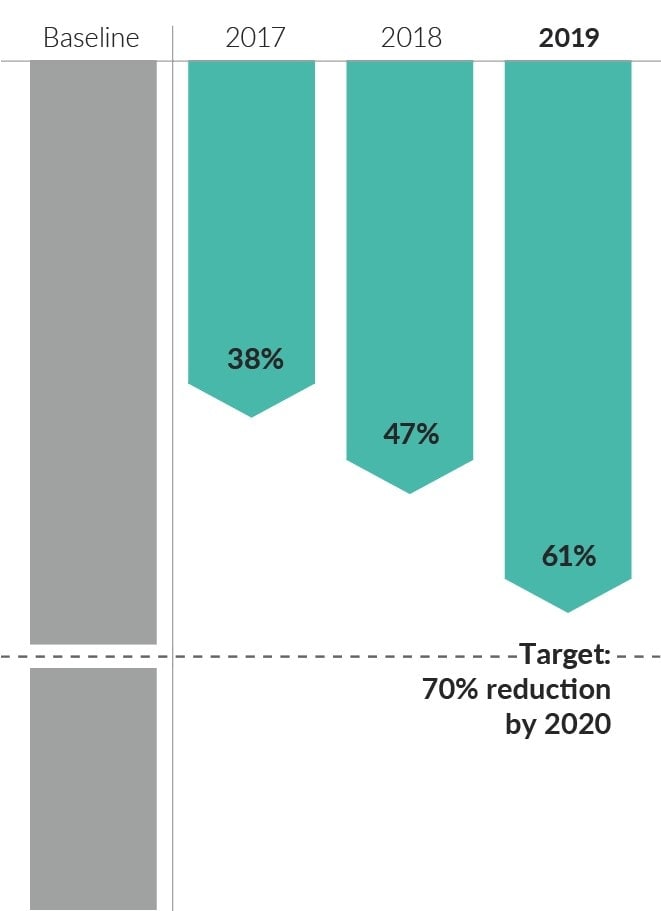
To meet our 2020 target of a 70 percent reduction, versus our 2010 baseline, in GHG emissions per kilogram of tobacco flue-cured, we have made curing barns more efficient, with a commitment to improve 80,000 barns by 2020. While most farmers own their curing barns, PMI and our suppliers provide guidance and support to make them more fuel-efficient. A primary reason for low efficiency is lack of insulation and the thermal conductivity of the construction materials. We work with farmers and suppliers to improve combustion efficiency, ventilation, and heating control, together with insulation.

The GHG emissions of flue-cured tobacco curing represent 10 percent of our total carbon footprint
The improvement projects carried out in 2019 increased the efficiency of 4,731 barns, for a cumulative total of 80,782 barns upgraded since 2014. Data on fuel use per kilogram of tobacco cured are subject to on-the-ground audits by third-party verifiers operating within our Monitoring and Verification Framework for Sustainable Fuel; these audits cover all CO2-reduction activities across our flue-cured tobacco supply chain. The challenges in improving curing barns pertain to farmer training, consistent delivery of the agreed improvements over the long term and verifying the new levels of efficiency.
In 2019, we delivered improvement projects around the world, which typically included training farmers on fuel efficiency. Depending on the farm upgrades needed, this training might focus on better convection of hot air inside the barn; insulation of the walls, ceiling, and floor; flue pipe and chimney adaptations for better heat control; innovative heat exchanger technology; or automation of dampers to control air circulation during the curing process.
We are seeing farmer profitability improve as a result of cost savings on farms. In Brazil, for example, the use of a “bulk barn” (an all-metal, rectangular barn) reduces the cost of production by 5 percent compared with a conventional barn, leading to an average increase in income of USD 242 per hectare. Efficiency improvements have led to savings of approximately USD 46 per hectare in the Philippines and USD 215 per hectare in Malawi.
Ensuring sustainable and traceable firewood sources
The curing process depends on heat, which, in some countries, is generated by burning firewood. By 2020, we are targeting 100 percent of the tobacco we purchase to be cured at no risk of deforestation of old growth forests. In 2019, we reached 97 percent, up from 90 percent in 2018. We detail our 2019 progress under Forest protection.
Reduction in CO2e emissions from tobacco flue-curing (%) - baseline 2010
Promoting the adoption of renewable fuels
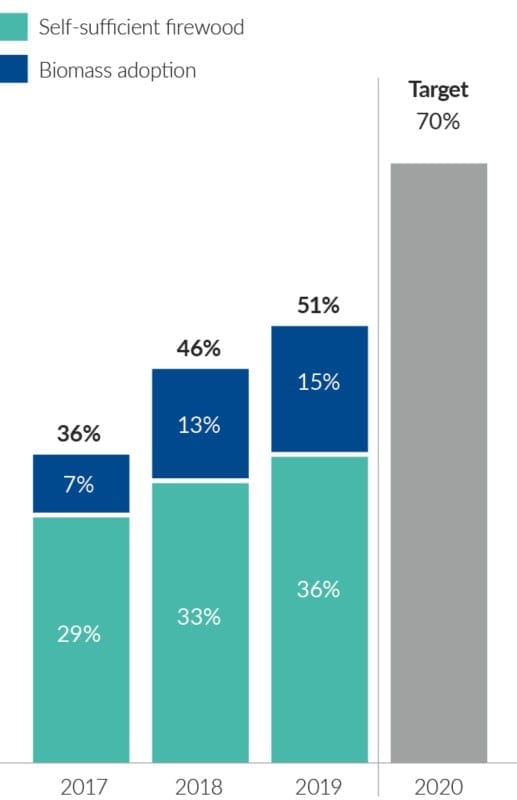
Our aim was to ensure that by 2019 55 percent, and by 2020 70 percent, of the flue-cured tobacco we purchase is cured using renewable and fully traceable fuels.1 These include sustainable biomass, such as wood sources, agro-pellets, or other agricultural waste products. We are applying our Monitoring and Verification Framework in all flue-cured sourcing markets. For audits begun in 2019, we aim to complete on-site visits covering all flue-cured origins by the end of 2020.
In 2019, 51 percent of the tobacco we purchased was cured using renewable fuels (2018: 46 percent). We have set a target to phase out completely the use of coal in curing the tobacco we purchase by 2020, with an intermediary target to achieve maximum 10 percent by 2019 (against 15 percent in 2018). The strong collaboration with our suppliers has led to significant improvements in the past years. By the end of 2019, the share of coal used as a curing fuel unfortunately increased slightly, to 16 percent. Due to shifts in our sourcing strategy and local curing capacities in specific markets, this figure does not fully reflect the steady progress made in fuel switch as a result of barn conversions in several markets. An example has been the cooperation with the China National Tobacco Corporation (CNTC) with the conversion of 51,567 barns from coal to biomass in recent years in the provinces PMI sources from, providing a reliable and consistent increase in curing capacity with renewable fuels. We remain committed to eliminating coal from our curing fuel portfolio and will provide an update on progress made in our next report.
Proportion of flue-cured tobacco purchased cured with renewable sources
Fertilizers
The use of fertilizers in tobacco production represented around 10 percent of PMI’s total carbon footprint in 2018, making it the third largest contributor of GHG emissions, after tobacco curing and acetate tow. While we encourage the optimization of fertilizers – minimizing their use in our tobacco supply chain in line with our Good Agricultural Practices – technological developments in the manufacturing process for fertilizers have also contributed to reducing their CO2 footprint.
In 2019, PMI updated its calculation model for fertilizers’ CO2 emissions, which had been developed in 2015, to more precisely assess their impact on the company’s carbon footprint. The total emissions calculated for 2019 are based on the updated model – taking into consideration efficiency gains and technological developments occurring in the manufacturing of fertilizers – and provide a more accurate figure. Emissions for 2019 represented 8 percent of PMI’s total footprint, and were significantly lower in absolute terms than in 2018. The decrease is explained both by the new emission factors, representing a 27 percent emission reduction compared with 2018 figures, and a further contribution due to a 13 percent decrease in fertilizer use.
Our direct materials supply chain
All our materials must be responsibly sourced, in line with our Responsible Sourcing Principles. In 2019, we worked on collecting primary data for our scope 3 emissions pertaining to our direct materials. The procurement categories with the greatest impact on our CO2 footprint are cellulose acetate tow, pulp, and paper (packaging board). We are currently engaging with our suppliers to develop an emissions reduction strategy in line with our carbon emissions reduction objectives.
In 2019, the CO2 reductions in our direct materials supply chain amounted to 71,225 tons of CO2, contributing 12 percent to our annual reduction across our value chain. We expect to achieve increasingly greater reductions in this category as we further develop our emissions reduction strategy in this area.
How we calculate CO2 emissions
PMI has collected CO2 emissions data over many years as part of our efforts to improve performance and achieve targets. We need robust data for our science-based targets, carbon footprint, product life-cycle analysis, and decisions on investment in low-carbon technologies.
In line with good practices and the World Resources Institute’s (WRI) GHG Protocol, we source emission factors from the U.K. government’s GHG Conversion Factors for Company Reporting (2019) and the International Energy Agency’s Emission Factors (2019). Global warming potential rates are sourced from the IPCC Fifth Assessment Report, 2014 (AR5). The scope of the data encompasses assets under our operational control, including PMI’s fleet and offices (scope 1 and 2), as well as our overall upstream and downstream supply chain (scope 3). Scope 2 emissions are primarily market-based. Our value chain carbon footprint model aligns with the Corporate Value Chain (Scope 3) Accounting and Reporting Standard methodology from the WRI, the accepted international standard.
We undertake third-party verification of scope 1, 2, and 3 emissions to ISO 14064-3 standards (please see our verification statements). Real data are used where possible, but in cases where primary data are not available, we extrapolate emissions from international databases such as ecoinvent. Transport relating to the end consumer traveling to the retailer is not included under value chain or product footprint standards. Gases included in calculations are CO2, CH4, and N2O (not HFCs, PFCs, SF4, or NF3). Biogenic CO2 emissions are included under our scope 3 emissions. The climate neutrality at our factory in Lithuania in 2019 encompassed all scope 1 and 2 GHG emissions of the manufacturing site that were validated; all remaining emissions were offset with high-quality carbon offset projects from myclimate, using certification from the Gold Standard Foundation.
Next steps
In 2019, we were on track or already meeting most of our existing CO2 targets, which had been based on the 2.0-degree scenario consistent with the 2016 Paris Agreement. Nevertheless, it became increasingly clear that society, including businesses, needs to be more ambitious to avert a climate crisis. The 2018 IPCC report recommended limiting global warming to 1.5 degrees, because of its “clear benefits to people and natural ecosystems,” as well as to ensure “a more sustainable and equitable society.” Toward the end of 2019, the European Union announced its Green Deal, aiming for EU-wide net zero carbon emissions by 2050.
These developments led to a heightened sense of urgency at PMI when it comes to reducing carbon emissions, and made us decide to step up our ambition. At the same time, the ongoing change in our business model toward smoke-free products made it opportune to update our baseline for target setting to 2019. We also wanted to better align our new targets with the ambitions conveyed by the European Union in its Green Deal, and other governments, and continue setting our targets consistent with the best scientific evidence.
Therefore, in early 2020, we established new and more ambitious targets to guide our decarbonization journey for the years to come:
PMI to be carbon-neutral by 2030 (scope 1 and 2);
our whole value chain to be carbon neutral by 2050 (scope 1, 2, and 3); and
a reduction in absolute CO2 emissions consistent with science-based targets for a 1.5-degree scenario.
During the course of 2020, we plan to submit our absolute reduction targets to the Science-Based Targets Initiative Committee for validation and expect to report on progress in next year’s report.
In addition to continuing, and where needed, stepping up our work, we also plan to roll out internal carbon pricing to drive PMI’s transition to a low-carbon operating scheme. Our roadmap also includes a gradual shift from improved process technologies to more disruptive technologies such as CO2 capture. In our product development work, we are increasingly embedding environmental criteria into the design process. To offset our unavoidable emissions, we focus on carbon in-setting projects to generate carbon credits. We will also launch an employee engagement campaign to prompt behavioral change. Finally, we will continue to improve the quality of our climate-related disclosures.
1 We calculate our carbon footprint using the “precautionary approach”: We use a full carbon emissions factor for firewood until proof is available 2017 2018 2020 that the source is sustainable.
This online supplement to our integrated report should be read in conjunction with PMI’s 2019 Integrated Report. The information and data presented in this online supplement cover the 2019 calendar year or reflect status at December 31, 2019, worldwide, unless otherwise indicated. Where not specified, data come from PMI estimates. See here for more information. Aspirational targets and goals do not constitute financial projections, and achievement of future results is subject to risks, uncertainties and inaccurate assumptions, as outlined in our forward-looking and cautionary statements.


